Databricks MLflow + Groq: Open-Source GenAI Observability
MLflow is an open-source platform developed by Databricks to assist in building better Generative AI (GenAI) applications.
MLflow provides a tracing feature that enhances model observability in your GenAI applications by capturing detailed information about the requests you make to the models within your applications. Tracing provides a way to record the inputs, outputs, and metadata associated with each intermediate step of a request, enabling you to easily pinpoint the source of bugs and unexpected behaviors.
The MLflow integration with Groq includes the following features:
- Tracing Dashboards: Monitor your interactions with models via Groq API with dashboards that include inputs, outputs, and metadata of spans
- Automated Tracing: A fully automated integration with Groq, which can be enabled by running
mlflow.groq.autolog() - Easy Manual Trace Instrumentation: Customize trace instrumentation through MLflow's high-level fluent APIs such as decorators, function wrappers and context managers
- OpenTelemetry Compatibility: MLflow Tracing supports exporting traces to an OpenTelemetry Collector, which can then be used to export traces to various backends such as Jaeger, Zipkin, and AWS X-Ray
- Package and Deploy Agents: Package and deploy your agents with Groq LLMs to an inference server with a variety of deployment targets
- Evaluation: Evaluate your agents using Groq LLMs with a wide range of metrics using a convenient API called
mlflow.evaluate()
Python Quick Start (2 minutes to hello world)
1. Install the required packages:
# The Groq integration is available in mlflow >= 2.20.0
pip install mlflow groq
2. Configure your Groq API key:
export GROQ_API_KEY="your-api-key"3. (Optional) Start your mlflow server
# This process is optional, but it is recommended to use MLflow tracking server for better visualization and additional features
mlflow server
4. Create your first traced Groq application:
Let's enable MLflow auto-tracing with the Groq SDK. For more configurations, refer to the documentation for mlflow.groq.
import mlflow
import groq
# Optional: Set a tracking URI and an experiment name if you have a tracking server
mlflow.set_tracking_uri("http://localhost:5000")
mlflow.set_experiment("Groq")
# Turn on auto tracing for Groq by calling mlflow.groq.autolog()
mlflow.groq.autolog()
client = groq.Groq()
# Use the create method to create new message
message = client.chat.completions.create(
model="qwen-2.5-32b",
messages=[
{
"role": "user",
"content": "Explain the importance of low latency LLMs.",
}
],
)
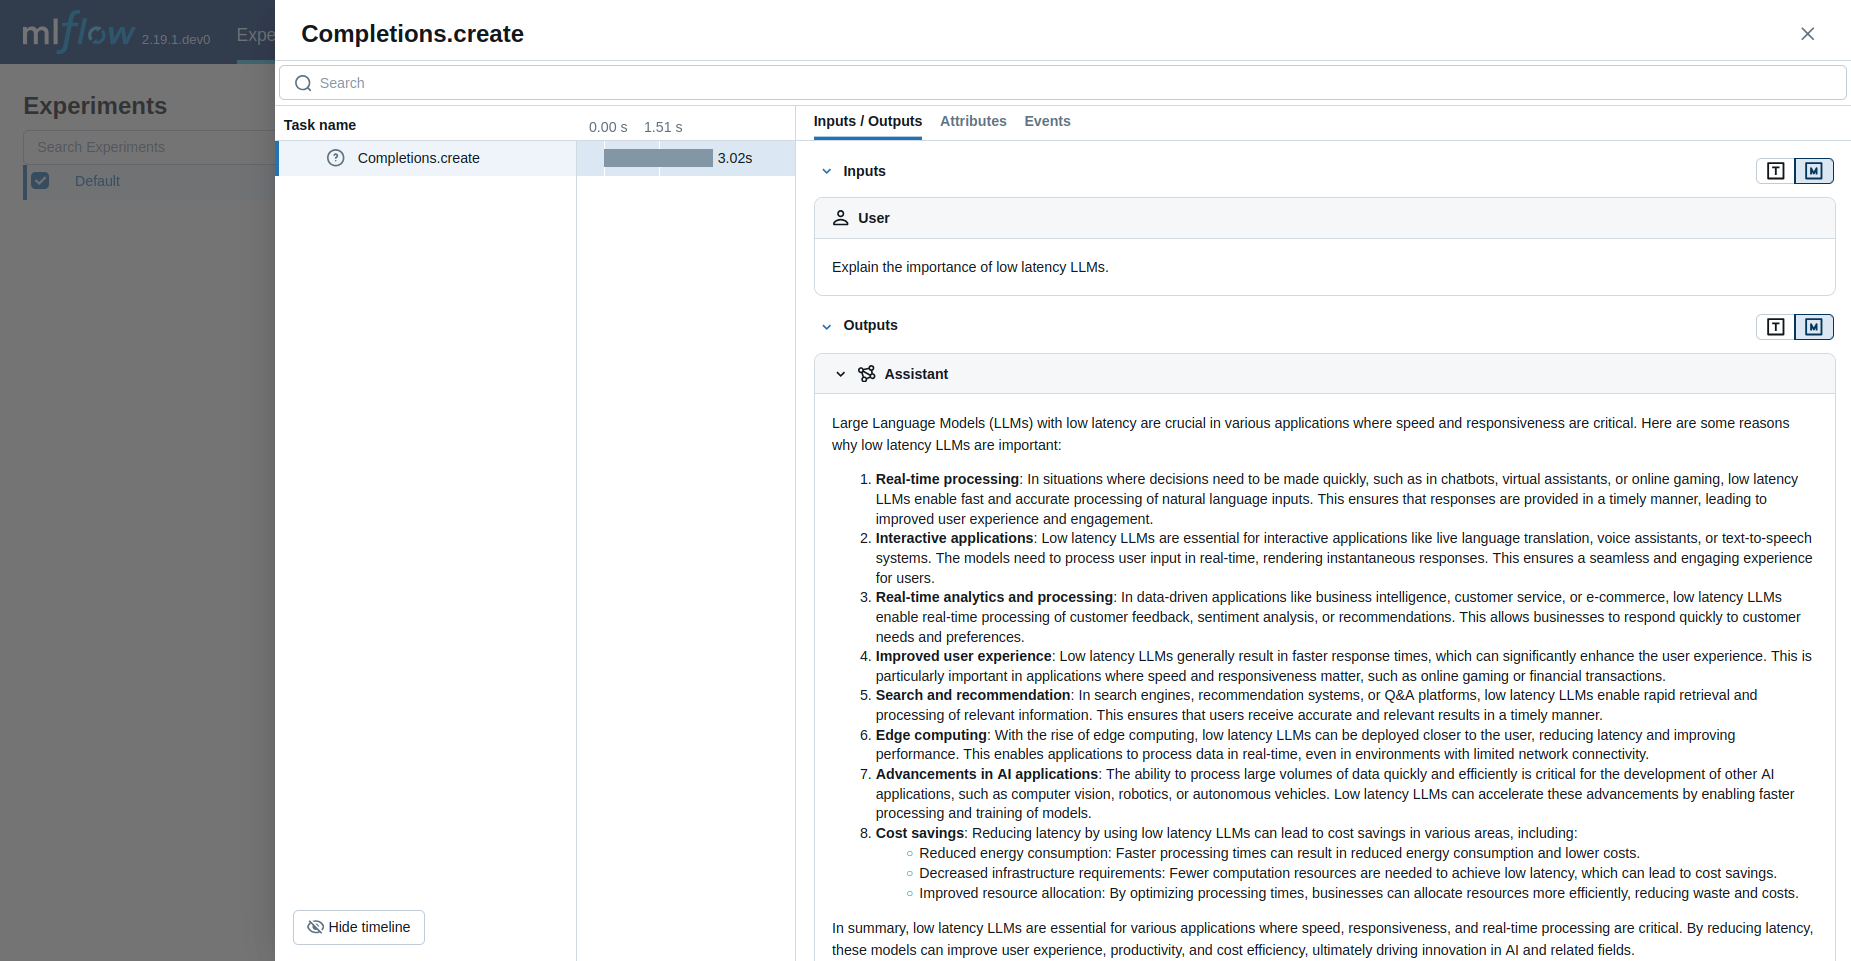
print(message.choices[0].message.content)5. Visualize model usage on the MLflow tracing dashboard:
Now traces for your Groq usage are captured by MLflow! Let's get insights into our application's activities by visiting the MLflow tracking server
we set in Step 4 above (mlflow.set_tracking_uri("http://localhost:5000")), which we can do by opening http://localhost:5000 in our browser.
Additional Resources
For more configuration and detailed resources for managing your Groq applications with MLflow, see: